Turn millions of rows into decisions in minutes.
DataPilots AI Agent cleans, profiles, joins, and visualizes your data — with evidence-based insights and exports you can trust.
Tested with 3 million records. Time and memory depend on file width and your device; plan row limits apply.
Secure uploads
Files are tied to your account and readable only by you and the members you invite.
Export-ready outputs
Excel workbooks, formatted PDF reports and high-resolution chart images.
Business-friendly dashboards
KPI cards, charts and pivot matrices built for reporting, not for coders.
Optional BYOK
Advanced users can connect their own AI provider key. Entirely optional.
Works with the data you already have
What goes in, what comes out
One path from the file on your desktop to the report in your review meeting.
- Excel workbooks (.xlsx, .xls)
- CSV exports
- Google Sheets
- Connected business data
- Analytics datasets
- Clean and structure
- Compare files and versions
- Calculate and aggregate
- Summarise and explain
- Visualise and answer questions
- Cleaned data files
- KPI dashboards
- Charts and pivot matrices
- Comparisons and variance
- Excel, PDF and PowerPoint reports
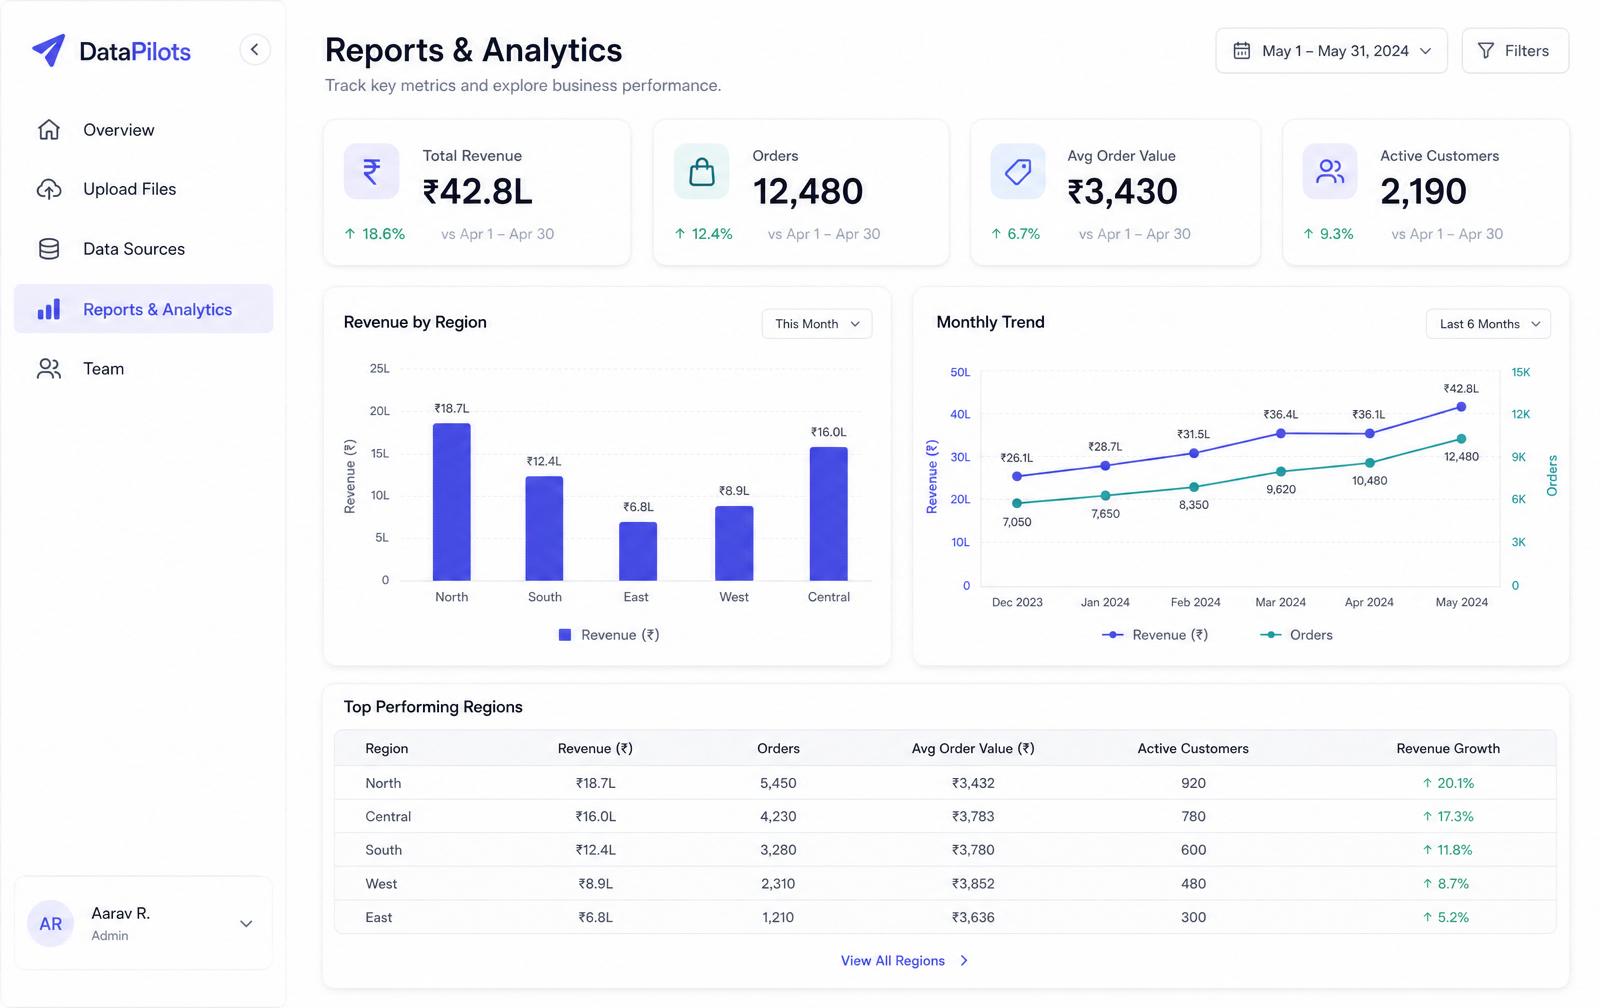
This is what you get
A real dashboard generated from an uploaded sales file — dataset-driven KPIs, visuals and a drill-down table, ready to filter and export.
Auto-generated KPIs
Totals, averages and top/bottom contributors picked from your columns.
Charts you control
Bar, line, area and pie — per-series colours, filters and click-through drill-downs.
Pivot matrices
Excel-style rows, columns and values with drag-and-drop fields.
PDF, Excel & PowerPoint export
Share a formatted report, hand over the workbook, or present a ready-made slide deck.
Built for the people who publish the numbers
Reporting teams, analysts, operators and founders — technical or not.
MIS Reporting
Convert recurring raw Excel files into clean, dashboard-ready reports every cycle.
Business Analytics
Ask questions, compare trends and generate KPI dashboards without building them by hand.
Operations Reporting
Track throughput, exceptions and branch-level performance from the exports you already receive.
Finance & KPI Review
Reconcile month-on-month files, calculate variance and publish a review-ready pack.
Agency & Client Reporting
Turn client data into branded PDF, Excel and PowerPoint deliverables in a single session.
Data Exploration
Prompt in English or Hindi to summarise datasets, test hypotheses and surface patterns fast.
From raw data to a review-ready decision
From a messy source file to a report your team can act on.
Built for real-world data
- Files up to 500 MB with chunked reading
- Streaming calculations and visible progress
- Multi-million-row processing tested; plan row limits apply
Excel, but smarter
- Profile every worksheet in your workbook
- Infer fact/dimension relationships
- Validate joins; clarify ambiguous relationships
Dashboards that make sense
- Up to 8 KPIs and 8 complementary visuals initially
- Semantic profiling, not random chart selection
- Add more later, with fields and calculations visible
Ask in your language
- English, हिन्दी and Hinglish prompts
- Text and voice on supported browsers
- Visible answers with evidence and verified calculations
One engine, everywhere
- Shared calculations across Reports, Dashboard and exports
- Multi-page workspaces and saved comparisons
- Live matrices, dynamic labels and annotations
Export like a pro
- PDF, Excel, CSV and CSV ZIP bundles
- PowerPoint with editable text and chart images
- Raw data, insights and direct email sharing
Data & file handling
Uploads up to 500 MB, multi-sheet Excel workbooks, cleaning and profiling — how DataPilots prepares your files.
ExploreThe DataPilots AI Agent
One bilingual assistant that profiles, cleans, calculates and builds dashboards from plain-language prompts.
ExploreDashboards & exports
KPI cards, charts, pivot matrices and insights — saved per page and exported to Excel, PDF or PowerPoint.
Explore
Spreadsheet cleanup & structuring
Header normalisation, removal of logo and title rows, empty row and column stripping, type and date standardisation — on files that were never built for reporting.

AI transformation & multi-file comparison
Describe the change in plain language — recalculate a column, group by branch, compare this month's file against last month's. The agent applies it and explains what it did.

KPI dashboards & export-ready reports
KPI cards, charts, pivot matrices and written insights on one saved dashboard — reopen next month, drop in the new file, export to Excel, PDF or PowerPoint.
One messy file, four steps, a finished report
Illustrative workflow. Results and timing depend on your source data and the steps you approve.
Upload raw file
A monthly Excel export with a logo band, merged titles and the real header sitting on row 6.
AI cleans and structures
Header row detected, blank rows and columns dropped, dates and numbers standardised, duplicates flagged.
Dashboard and KPIs generated
Relevant KPIs and visuals are selected from the actual dataset, with drill-down tables and a written summary.
Export and share
Download the cleaned dataset, an Excel workbook or a formatted PDF report for your review meeting.
Before — raw upload
- Logo band and merged title rows above the data
- Real header sitting on row 6
- Blank rows, blank columns and duplicate entries
- Dates stored as text, amounts stored as strings
After — decision-ready output
- Cleaned, typed table you can download
- Relevant KPIs with trend sparklines
- Charts, drill-down tables and a pivot matrix
- Written insight summary with the numbers cited
- Excel workbook and formatted PDF report
Ask in the language your team already uses
Request dashboards, summaries, comparisons or calculations in English, Hindi or a mix of both — typed or spoken. The analysis, tool steps and chart output are identical in every language; only the wording of the answer changes.
- Plain English or Hindi — including Hinglish prompts
- Voice commands on supported browsers, in both languages
- Business wording, not query syntax — no formulas required
- Follow-up questions keep the context of your dataset
“Compare March and April sales by region and show the biggest drops.”
Illustrative reply: a comparison chart and measured regional changes appear after the tools verify the calculation.
“पिछले छह महीने का रेवेन्यू ट्रेंड चार्ट बनाओ और अगले महीने का अनुमान दो।”
उदाहरण: तारीखों और उपलब्ध डेटा की जाँच के बाद ट्रेंड दिखाएँ; अनुमान को स्पष्ट रूप से चिह्नित करें।
“Top 10 customers ka KPI card banao aur PDF export ready karo.”
Illustrative reply: verified changes appear on your current page. Apply the export preview before downloading.
DataPilots AI Agent
The DataPilots AI Agent works on your actual data — cleaning it, calculating on it, explaining it and building the dashboard. The Interactive AI Assistant sits alongside it to answer questions and refine anything on screen.
Cleaning & structuring
Finds the real header row under logos and title bands, drops blank rows and columns, de-duplicates, and standardises dates, numbers and text — without touching your original file.
Multi-sheet & multi-file
Reads every sheet in a workbook, lets you choose which to analyse, and compares several files side by side — this month against last, source against source.
Complex calculations
Custom formulas and calculated columns, running totals, moving averages, ratios, variance and percentage change computed across the full dataset, not a sample.
Trends & forecasting
Detects direction, seasonality and outliers, then projects forward — rendered as trend lines, combo charts and multi-series comparisons on your dashboard.
Insights & suggestions
Plain-language summaries of what changed and why, with recommended next checks and the KPIs worth watching for your dataset.
Prompt-built dashboards
Ask in normal language and the agent creates or edits KPIs, charts, tables and pivot matrices — and hands back the cleaned, transformed file to download.
Your data stays yours
No lock-in, no black box, no formulas or code required to get value.
Account-scoped access
Datasets are readable only by you and the members you invite, enforced by row-level rules in the database.
Secure uploads
All traffic runs over HTTPS, and subscription payments are processed securely by Cashfree.
Exportable outputs
Take cleaned data, workbooks, PDF reports and chart images with you at any time.
Optional BYOK
Connect a supported provider key in the dedicated AI settings form if you prefer provider billing.
Original files preserved
Cleaning works on a working copy. Your original uploaded files are never modified.
Review before sharing
AI suggestions support—not replace—business review. Enter credentials only in dedicated connection forms.
Frequently asked questions
What analytics, operations and reporting teams usually ask before subscribing.
Still have a question? Talk to our team
Your next report starts with one file
Start on the 14-day trial, upload a spreadsheet, and get a cleaned dataset, KPIs, charts and an export-ready report in the same session. Basic ₹1,999/month, Pro ₹3,499/month.
Built for MIS teams, analysts, operators and data-driven businesses.